
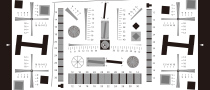


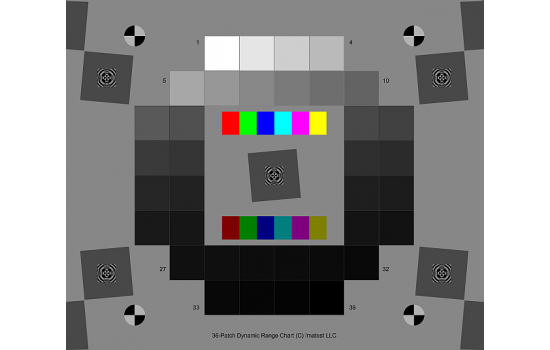
This chart has 36 low-noise density patches with density steps of approximately 0.1, for a density range of at least 3.2 (density from base to base + 3.1 minimum). A nearly circular patch arrangement ensures that vignetting has minimal effect on results. A CSV reference file with actual densities will be supplied. The chart has an active area of 197x235 mm (7.75x9.25 inches) on 203x254 mm (8x10 inch) film.
It also contains slanted edges in the center and corners with 4:1 contrast for measuring MTF. The edges have an MTF50 >= 16 cycles/mm, which is about 3 times better than the best inkjet charts. Registration marks make the regions easy to select. A neutral gray background helps ensure that the chart will be well-exposed in auto exposure cameras (compared to charts with black backgrounds, which are sometimes strongly overexposed).
It is supported by Stepchart, Multicharts, Multitest and can be used with the Dynamic Range postprocessor if several manual exposures are available. Dmax >= 3.4 is sufficient for camera phones and digital cameras with small pixel sizes, but high-end DSLRs generally have higher dynamic ranges (and also manual exposure), which makes them well suited for Dynamic Range.
This chart is produced with a high-precision LVT film recording process for the best possible density range, low noise, and fine detail.