


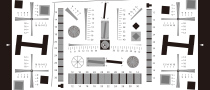


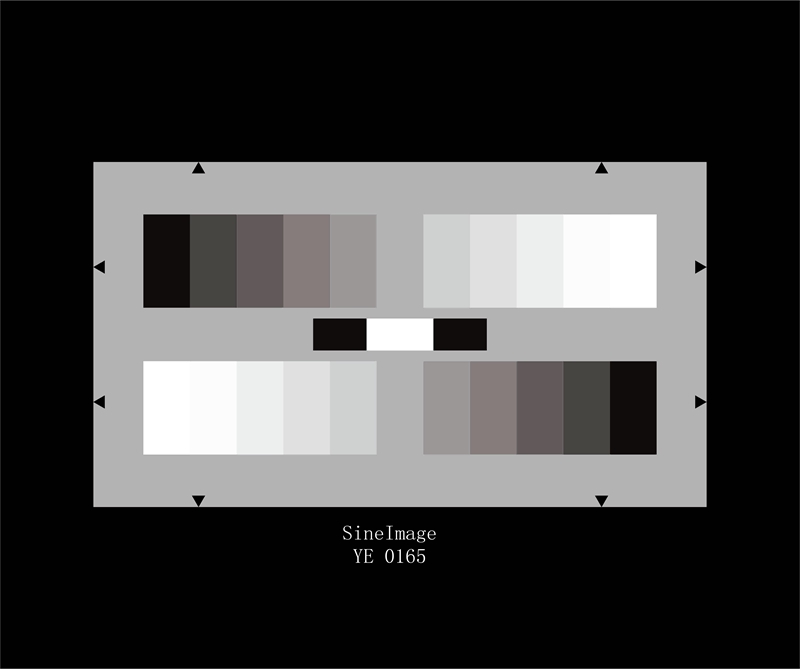
The YE 0165 is designed for evaluation the halftone reproduction of 16:9 electronic cameras. Two 11-graduated counter current gray scales are arranged on a gray background (D ≈ 0.56), the gray scale corresponds to the ITU recommendation BT.709.
The output signal of an optimally gamma-corrected camera according to BT.709 generates two counter current, linear step signals.
The contrast range of the gray scale is 40 : 1.
The values of the 11-graduated gray scale are as follows:
| Step | Density | Remission in % | Video signal for BT.709 in % | Video signal for gamma 0.45 in % |
| 1 | 0.05 | 89 | 100 | 100 |
| 2 | 0.13 | 74 | 91 | 92 |
| 3 | 0.22 | 60 | 82 | 84 |
| 4 | 0.32 | 48 | 73 | 75 |
| 5 | 0.43 | 37 | 64 | 67 |
| 6 | 0.56 | 28 | 55 | 59 |
| 7 | 0.70 | 20 | 46 | 51 |
| 8 | 0.88 | 13 | 37 | 43 |
| 9 | 1.08 | 8 | 28 | 35 |
| 10 | 1.34 | 5 | 19 | 26 |
| 11 | 1.64* | 2 | 11 | 19 |
*The production process for reflective charts allow a maximum printed density of 1.64. The target value for the darkest step is 1.70. Therefore the distance of the last step differ slightly.
Two black fields and a white field are located between the gray scales. The density of the black fields in the middle is D > 3 (remission < 0.1 %), the white field between has a density of 0.05 (remission 89.9%).
Recommended usage:
Adjust the aperture until the lightest patch reaches 100% video signal at the waveform monitor. With an optimally corrected camera according to ITU recommendation BT.709 the darkest patch will reach 10% signal level.
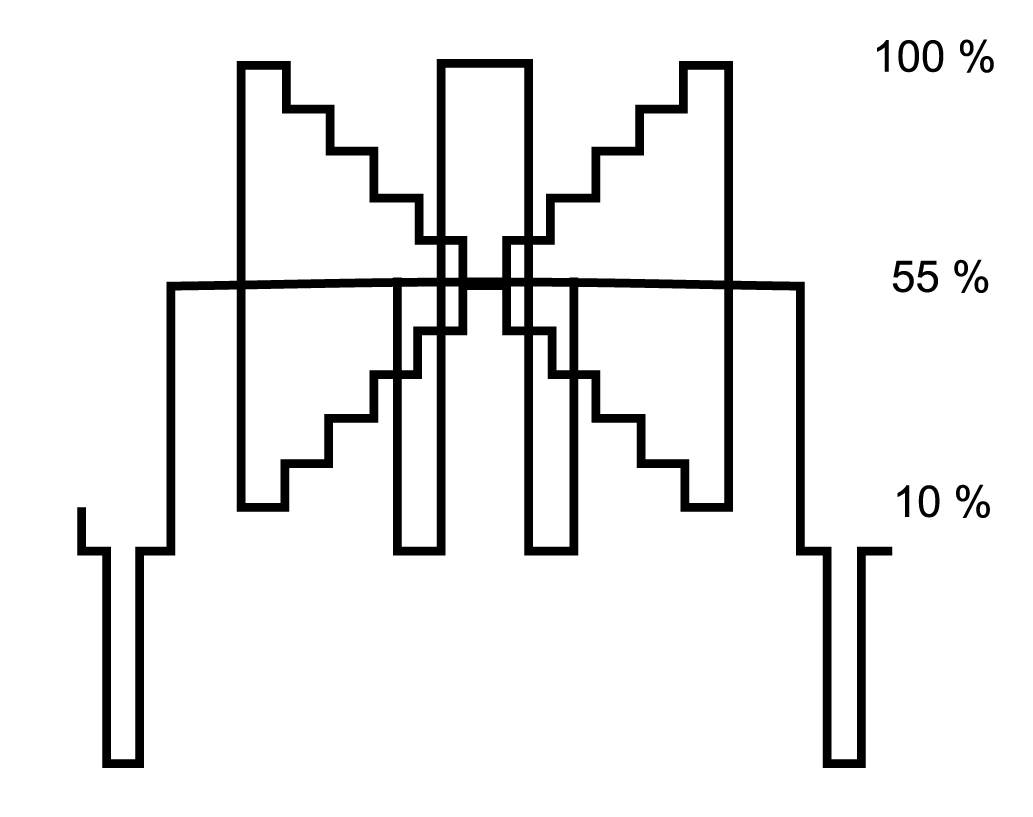
When using this chart with a gamma correction of 0.45 the video signal level for each step will change as listed in the table above.