


Contrast Ratios Options
- 4:1 contrast ratio matches the upcoming new ISO-12233 specs.
- 10:1 and 2:1 contrast ratios Use of both contrast levels improves ability to analyze non-linear signal processing, which may not affect the lower contrast 2:1 contrast ratio regions
- 10:1 contrast only improves the completeness of 3D maps of performance across the imaging surface.
Paper Type - Semi-gloss or Matte Options
- Matte paper can be easier to light because it has less specular reflection than the semi-gloss paper. The MTF is slightly less than semi-gloss paper and does not have as deep dark tones on the stepchart.
- Semi-gloss paper has slightly higher detail than matte, has deeper black tones on the stepchart, and is recommended for most applications except for wide-angle lenses.
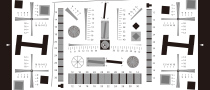
Square Grid Dimensions Options
- 5x9 grid dimension is recommended for for typical DSLR formats with aspect ratios of 3:2 and typical HDTV formats with aspect ratios of 16:9.
- 5x7 grid dimension is recommended for typical compact camera formats with aspect ratios of 4:3.
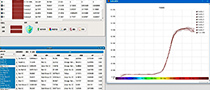
Ink Jet Chart Resolution
This chart, and all our ink jet printed charts have an approximate MTF50 of 5 cycles/mm. For a comparison of rflective surfaces, as well as what this means when choosing your chart, please visit our Reflective Surface Comparison Blog. Please keep this in mind when choosing the size of chart. Using a chart that is too small with a high-resolution sensor can result in the MTF of the chart degrading the measured MTF of the camera system. In addition, it is important to use a chart that is large enough to accomodate the minimum focus distance, as well as the resultion of your sensor.
Paper Size and Active Area Options
Charts are available in five main sizes with variations depending on the grid dimensions selected. It is recommended that the medium sized charts be used to test imaging systems with sensors up to 12 MP, the large charts be used for testing of sensors above 12 MP and up to approximately 24 MP, and the extra-large charts be used for sensor sizes above 24 MP.
Paper Size (Including Margin)
| Square Dimensions | ||
|---|---|---|
| 5x9 | 5x7 | |
| X-Small | 8.5" × 15" | 8.5" × 10" |
| Small | 14" × 24" | 14" × 20" |
| Medium | 24" × 40" | 24" × 34" |
| Large | 44" × 60" | 44" × 60" |
| X-Large | 44" × 74" | 44" × 64" |
Active Area
The active area of the chart includes white space above and below the top and bottom distortion bars. It is slightly larger than the printed area, which is bounded by the distortion bars on top and bottom. White space is included in active area because test images of the chart must include this white space in order to enable automated processing in SFRplus software.
| Square Dimensions | ||
|---|---|---|
| 5x9 | 5x7 | |
| X-Small | 7.85" × 15" | 6.75" × 10" |
| Small | 12.5" × 24" | 13.5" × 20" |
| Medium | 22" × 39.22" | 22" × 33" |
| Large | 33" × 59" | 40" × 59" |
| X-Large | 42" × 72" | 42" × 59" |
Color Chart Options
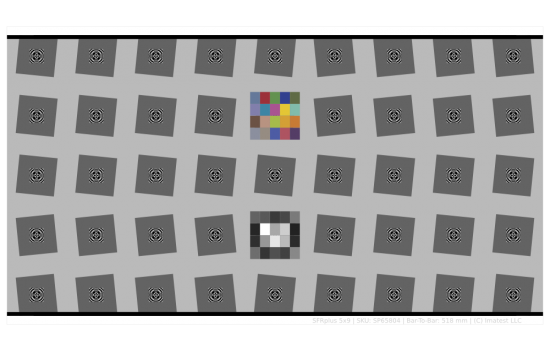
Inclusion of the color chart enables testing of color accuracy. If the color option is selected, the "focus star" pattern that aides in focusing is replaced by a 20 patch color chart.
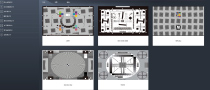
Pre-Distortion Options
Pre-distorted charts offer the ability to map the outer edges of a wide angle or fisheye lens using SFRplus. These distortion levels are available
| Level | Matrix |
|---|---|
| No distortion | [1 1] |
| Distort | [0.833 1.123] |
| Distort+ | [1.167 1.577] |
| Ultradistort | [1.167 1.982] |
We do not recommend using semi-gloss paper for wide angle lenses or pre-distorted charts