


Automotive Test Chart
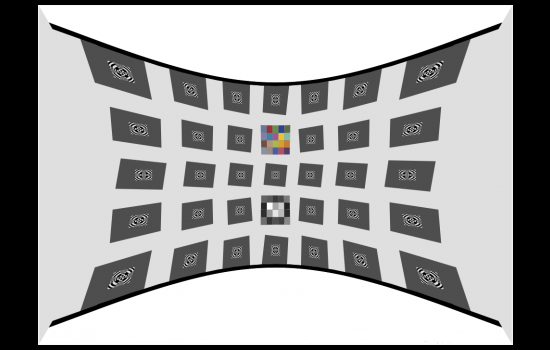
This chart is designed for testing automative cameras or other significantly distorted cameras. This large chart is designed to be reflectively lit, and captured at a an optimal focus distance. Options include: Pre-distortion:Most automotiv
Introduction
This chart is designed for testing automative cameras or other significantly distorted cameras. This large chart is designed to be reflectively lit, and captured at a an optimal focus distance.
Options include:
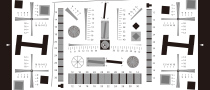
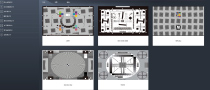
- Pre-distortion: Most automotive camera modules have significant fisheye distortion which can make it difficult to the outside of the image field. this chart has pincussion pre-distortion to approximately compensate for the barrel distiortion of the automotive camera module. The distortion coefficients that should be entered into the Imatest SFRplus settings window are [1.167 1.577]
- Square Grid: 5x7 slanted square grid
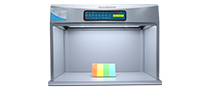
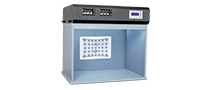
- Substrate & ink type: Matte paper & ink can be used to reduce reflected light. This is critical for high levels of distiortion, otherwise specular reflections can ruin MTF measurements
- Contrast levels: 10:1 contrast ratio, common for several automative testing standards
- Color chart: a 20 patch color chart for color accuracy and bayer filter position verification
- Bar to Bar height: the maximum bar to bar height is 38.5 inches on the left and right side. The minimum bar to bar height is 23.5 inches in the center.
- Active Area: the extra-large chart be used for sensor sizes above 24 MP. This chart has an active area of 1500mm x 965mm and is printed on 1117 mm X 1524 mm inch paper
The active area of the chart includes white space above and below the top and bottom distortion bars. It is slightly larger than the printed area, which is bounded by the distortion bars on top and bottom. White space is included in active area because test images of the chart must include this white space in order to enable automated processing in SFRplus software.