


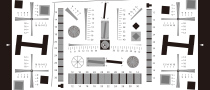


The test chart consists of a blank film between two glass panes.
The test chart is designed for shading measurement under the same lightning conditions as other transparency measurements.
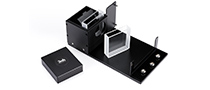
It is possible to perform shading measurements on illuminator (LG2, LE6) without any chart. But then lightning conditions are different to other measurements with test transparencies. By using a test transparency the light intensity of an illuminator changes.
This is caused by two superimposed factors
a) the filter effect of the film and glass (25% light absorption) and
b) the light remission of the transparency ack in the illuminator
While factor a) is predominat with th LG2, the remission factor b) is predominant with the lightning sphere LE6, i.e. the light intensity rises significantly when a test chart is inserted. To carry out shading measurement under the same lighting condition as other measurements the use of the YE0178 is essential.
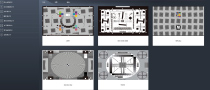
Definition of white shading or white level uniformity
Determination of maximum white level variations in various areas of the picture, when the camera is directed at an evenly illuminated test chart.